This is Part-1 of a 3 part series on how to proactively handle errors in your applications across the stack.
Note: You will need slack access for this tutorial.
As engineers, we toil all day, write tests, test our APIs manually, work through various scenarios and user flows before we raise a PR to get our code merged in. Peer Pull Request reviews - one of the best forms of collaboration, act as an extra set of eyes that help identify missing conventions and use cases.
This helps build a more stable product. All these things are done to reduce the risk of failure. However, as all of you know, and have very well experienced, there will be unanticipated issues in production. Could be related to a third-party service malfunctioning, or a system failure. Yes, AWS goes down too!
One out of two things can happen in this case.
- A disgruntled customer can inform you about inconsistencies or failures in your system.
- Or, we could put processes in place that proactively alert us if there are issues and we can tackle them head-on.
Let's say that you do get informed proactively. You need to now search through hundreds of GBs of data in the application logs to be able to root cause and fix the issues.
In this tutorial, I will take you through how to integrate slack alerts for failures in your application. We will also go over how to associate an ID for each incoming request to the server. We will use the requestID in the slack alerts for easy debugging.
This tutorial assumes that you have a good understanding of
In case you are not familiar with the above please take some time to go through the documentation
In this tutorial, you will
- Create a logger middleware that associates a request ID with each incoming request
- Create a slack webhook
- Create a slack service that will send messages to different channels for dev and production.
Starter Project
Please clone the following repository: https://github.com/wednesday-solutions/node-express-slack-alert
Create a logger middleware
We will now add a middleware that will be run for each incoming request. This middleware will generate a UUID and associate it with all logs.
Step 1
Add the following dependencies
- winston
- cls-rtracer
Step 2
Register the middleware in the server/index.js
This ensures that for ever request we are getting a new request-id
Step 3
Log the request-id in the health-check API
Run the application using the following command
The application starts running on port 9000.Go to http://localhost:9000 in the browser to hit the health-check API
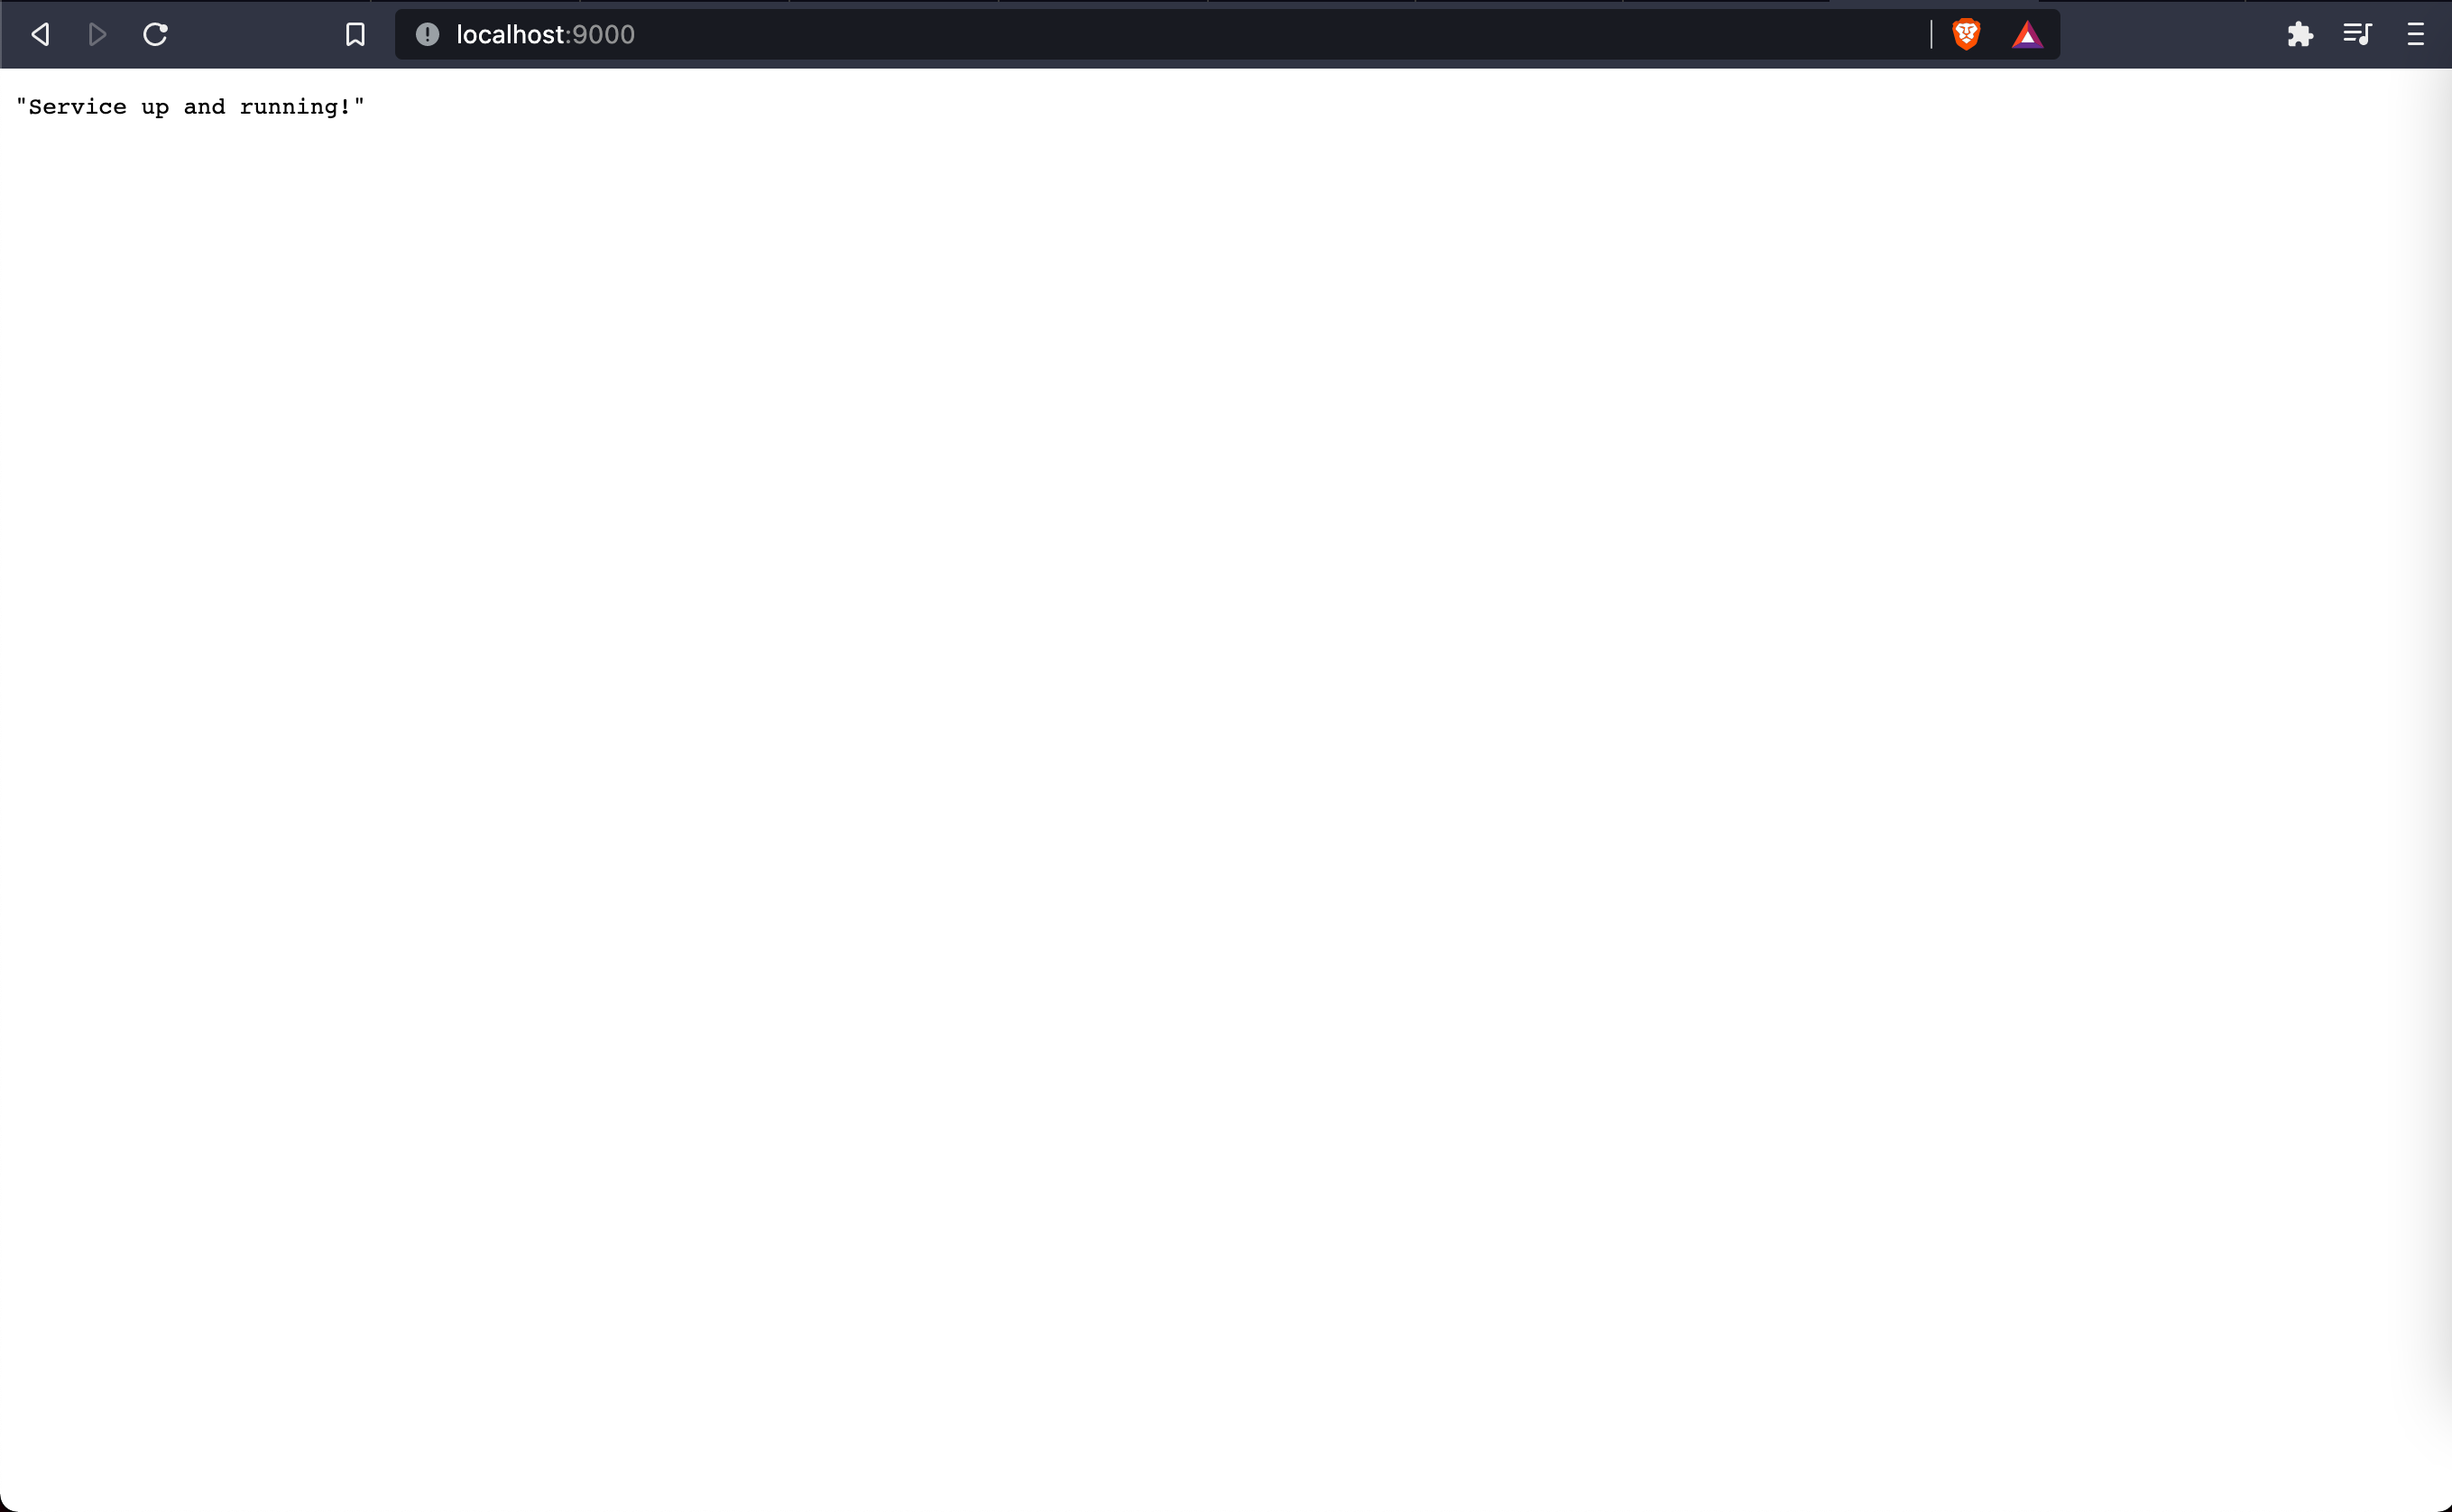
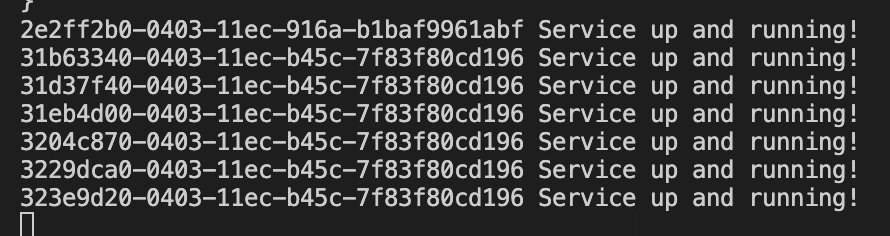
Refresh the page a few times and watch the logs.
For each request you have a new request-id now.
As a final check lets now add multiple console logs and ensure that the request-id for a single request is constant.
Add this snippet
This will console log the request-id and the time when the log was printed.

Step 4
Create a logger function that combines winston and cls-rtacer
In the utils/index.js
Logger will remove the need to invoke rTracer.id manually. Whenever logger.info is invoked the message is prefixed with the timestamp and the request-id
Let's use logger in the health check API
Now run the app using the following command
Hit the health check API and let the magic unfurl!
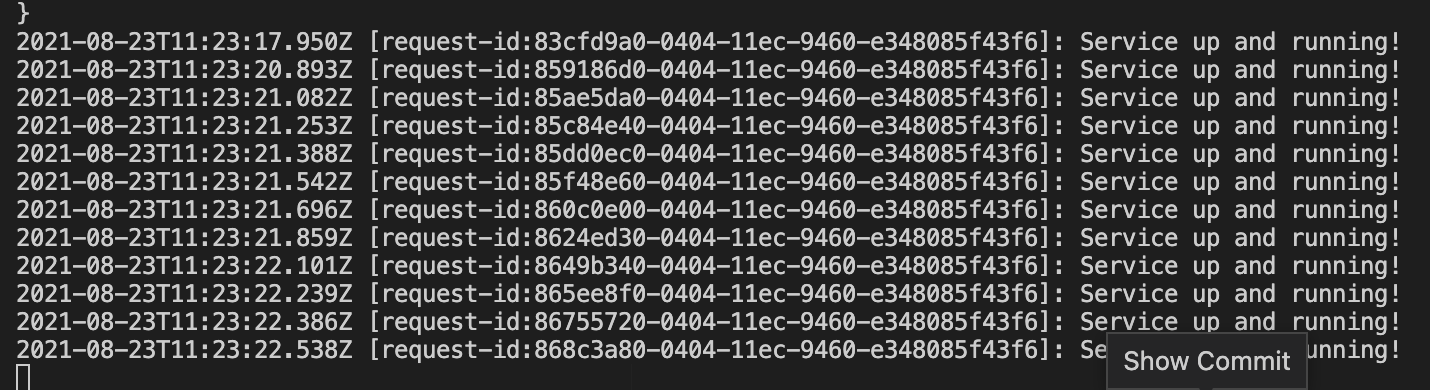
We now have a framework that allows us to attribute logs to a particular request.
The slack alerts sent in case of failures will contain the request-id in question. This will help filter through the logs and only retrieve relevant information.
Quick interruption: Discover why top C-level execs are subscribing to LeadReads. Dive into the world of digital products – you'll be glad you did!
Join here.
Create a slack webhook
Step 1
Install the slack-notify dependency.
Step 2
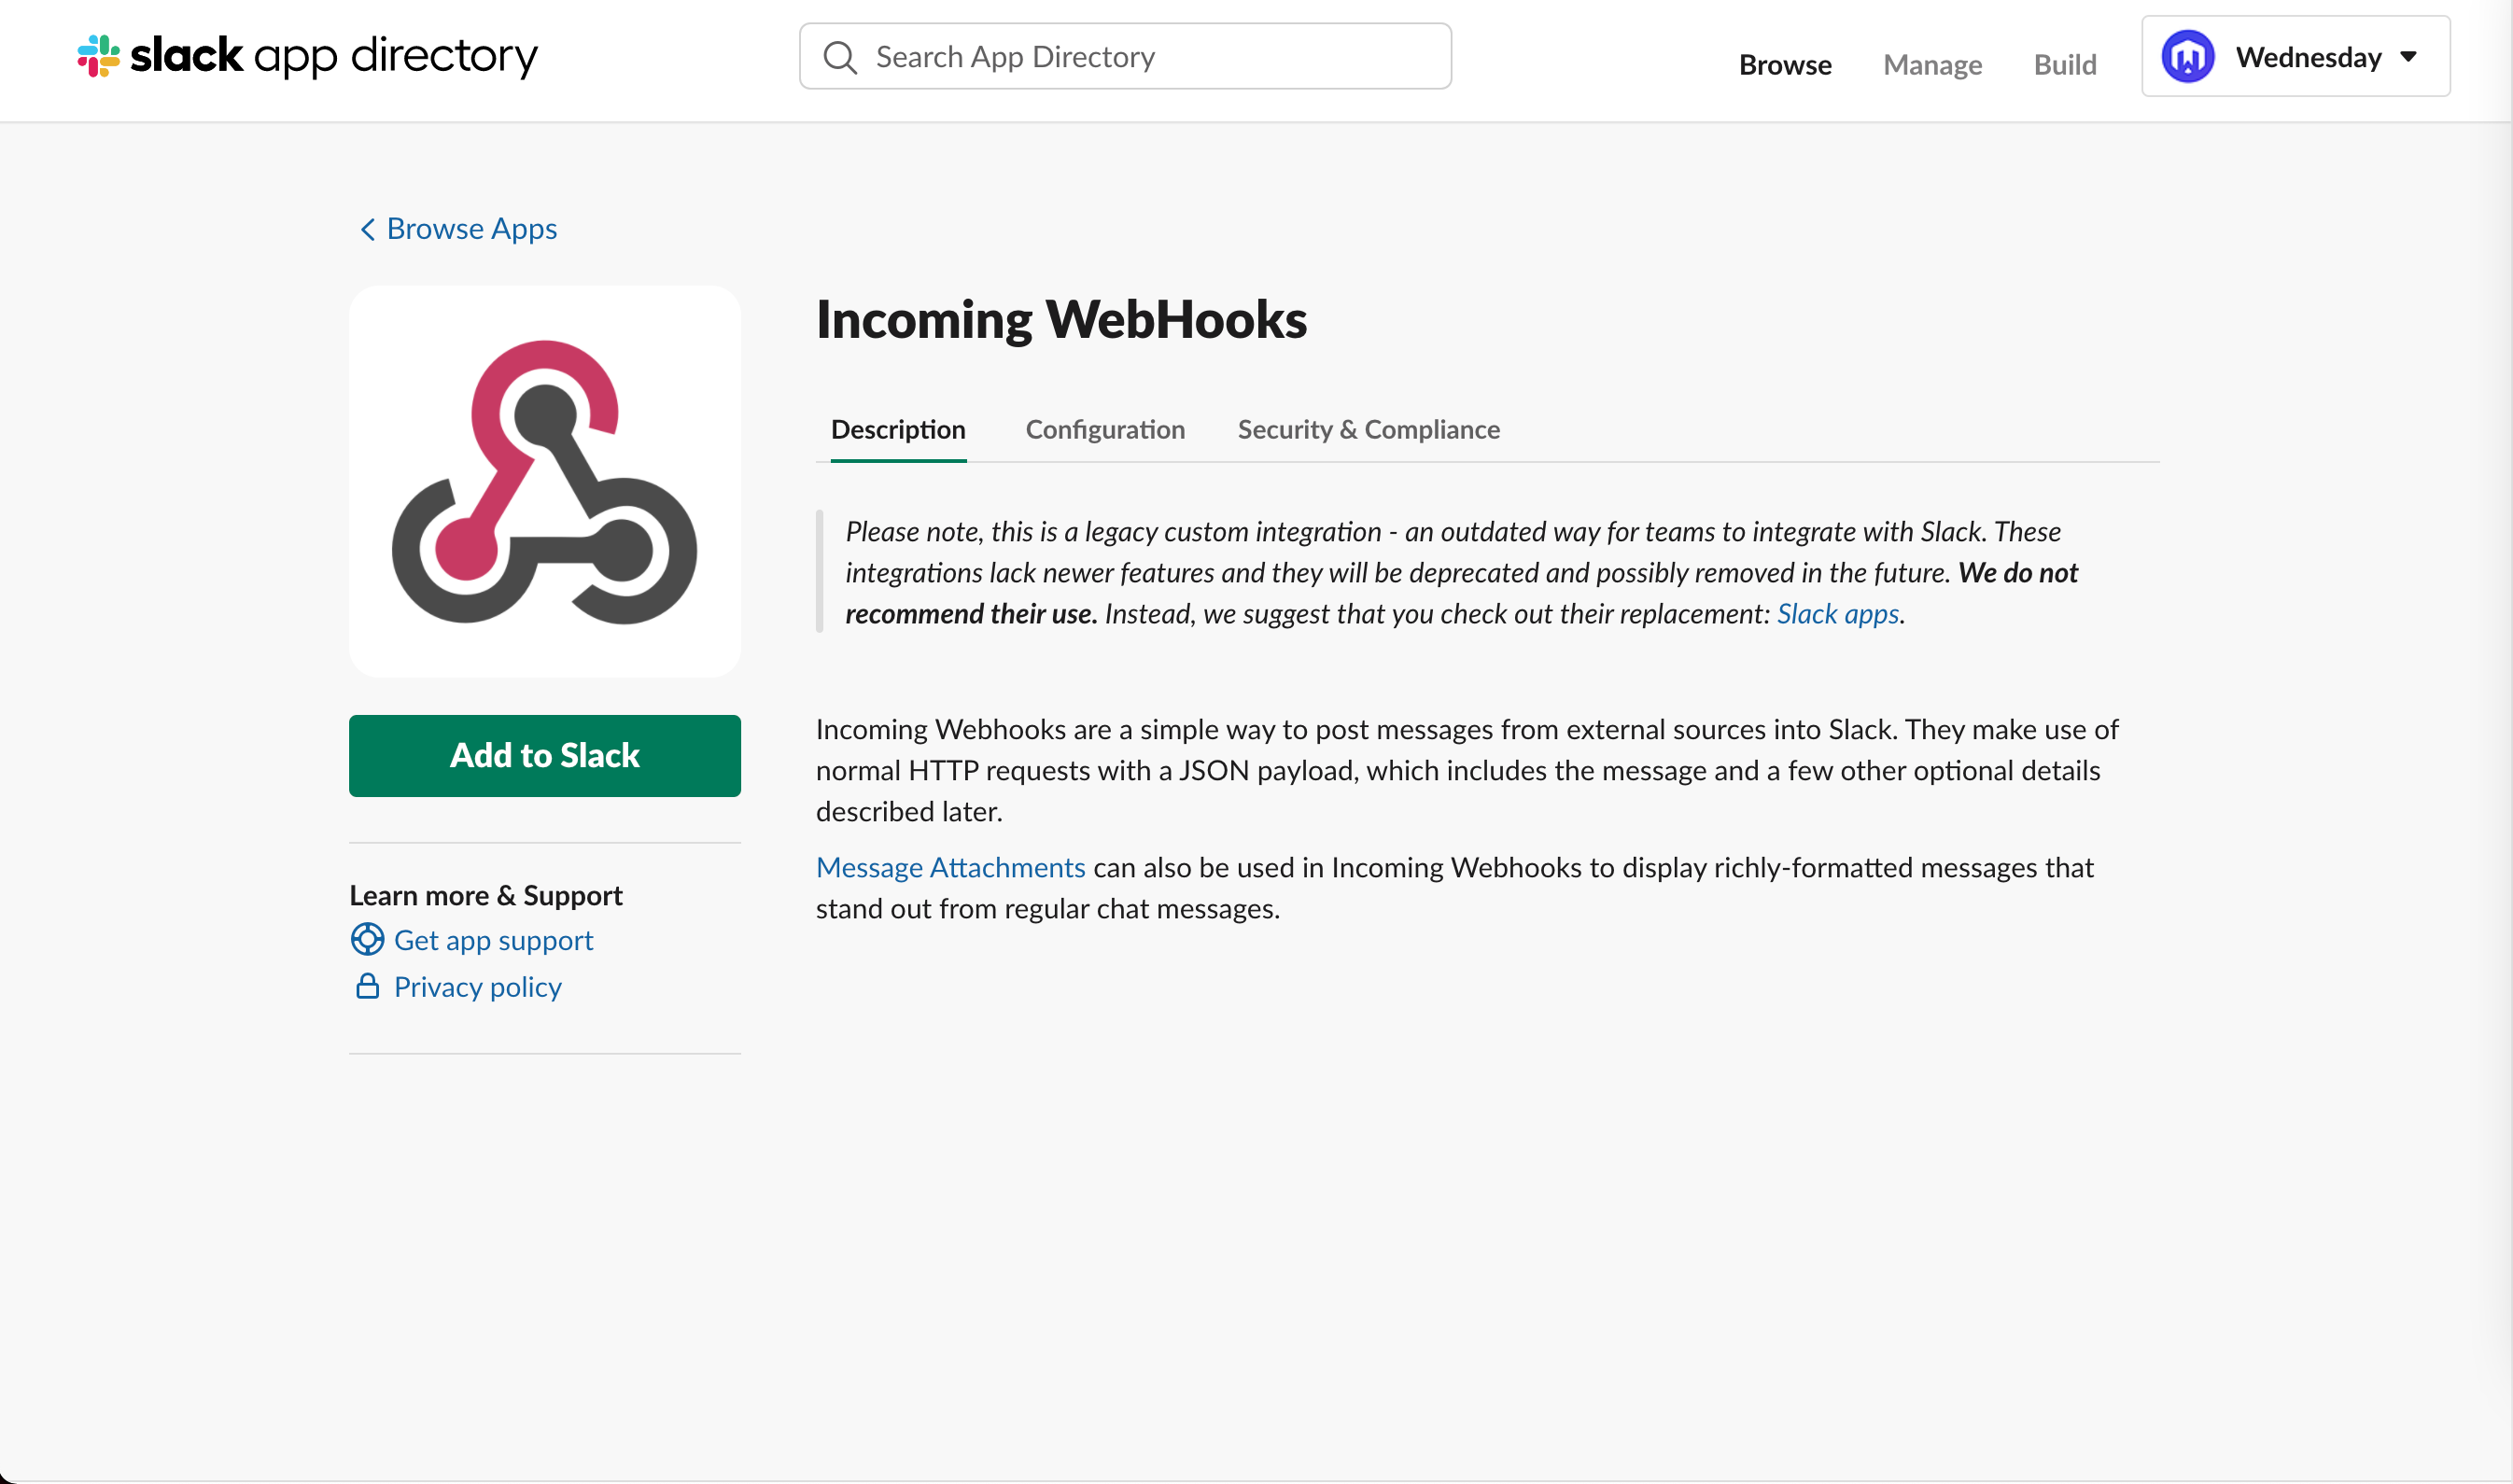
We will now create an incoming webhook. Go to https://<your-domain-name>.slack.com/apps/manage/custom-integrations. Click on Incoming WebHooks
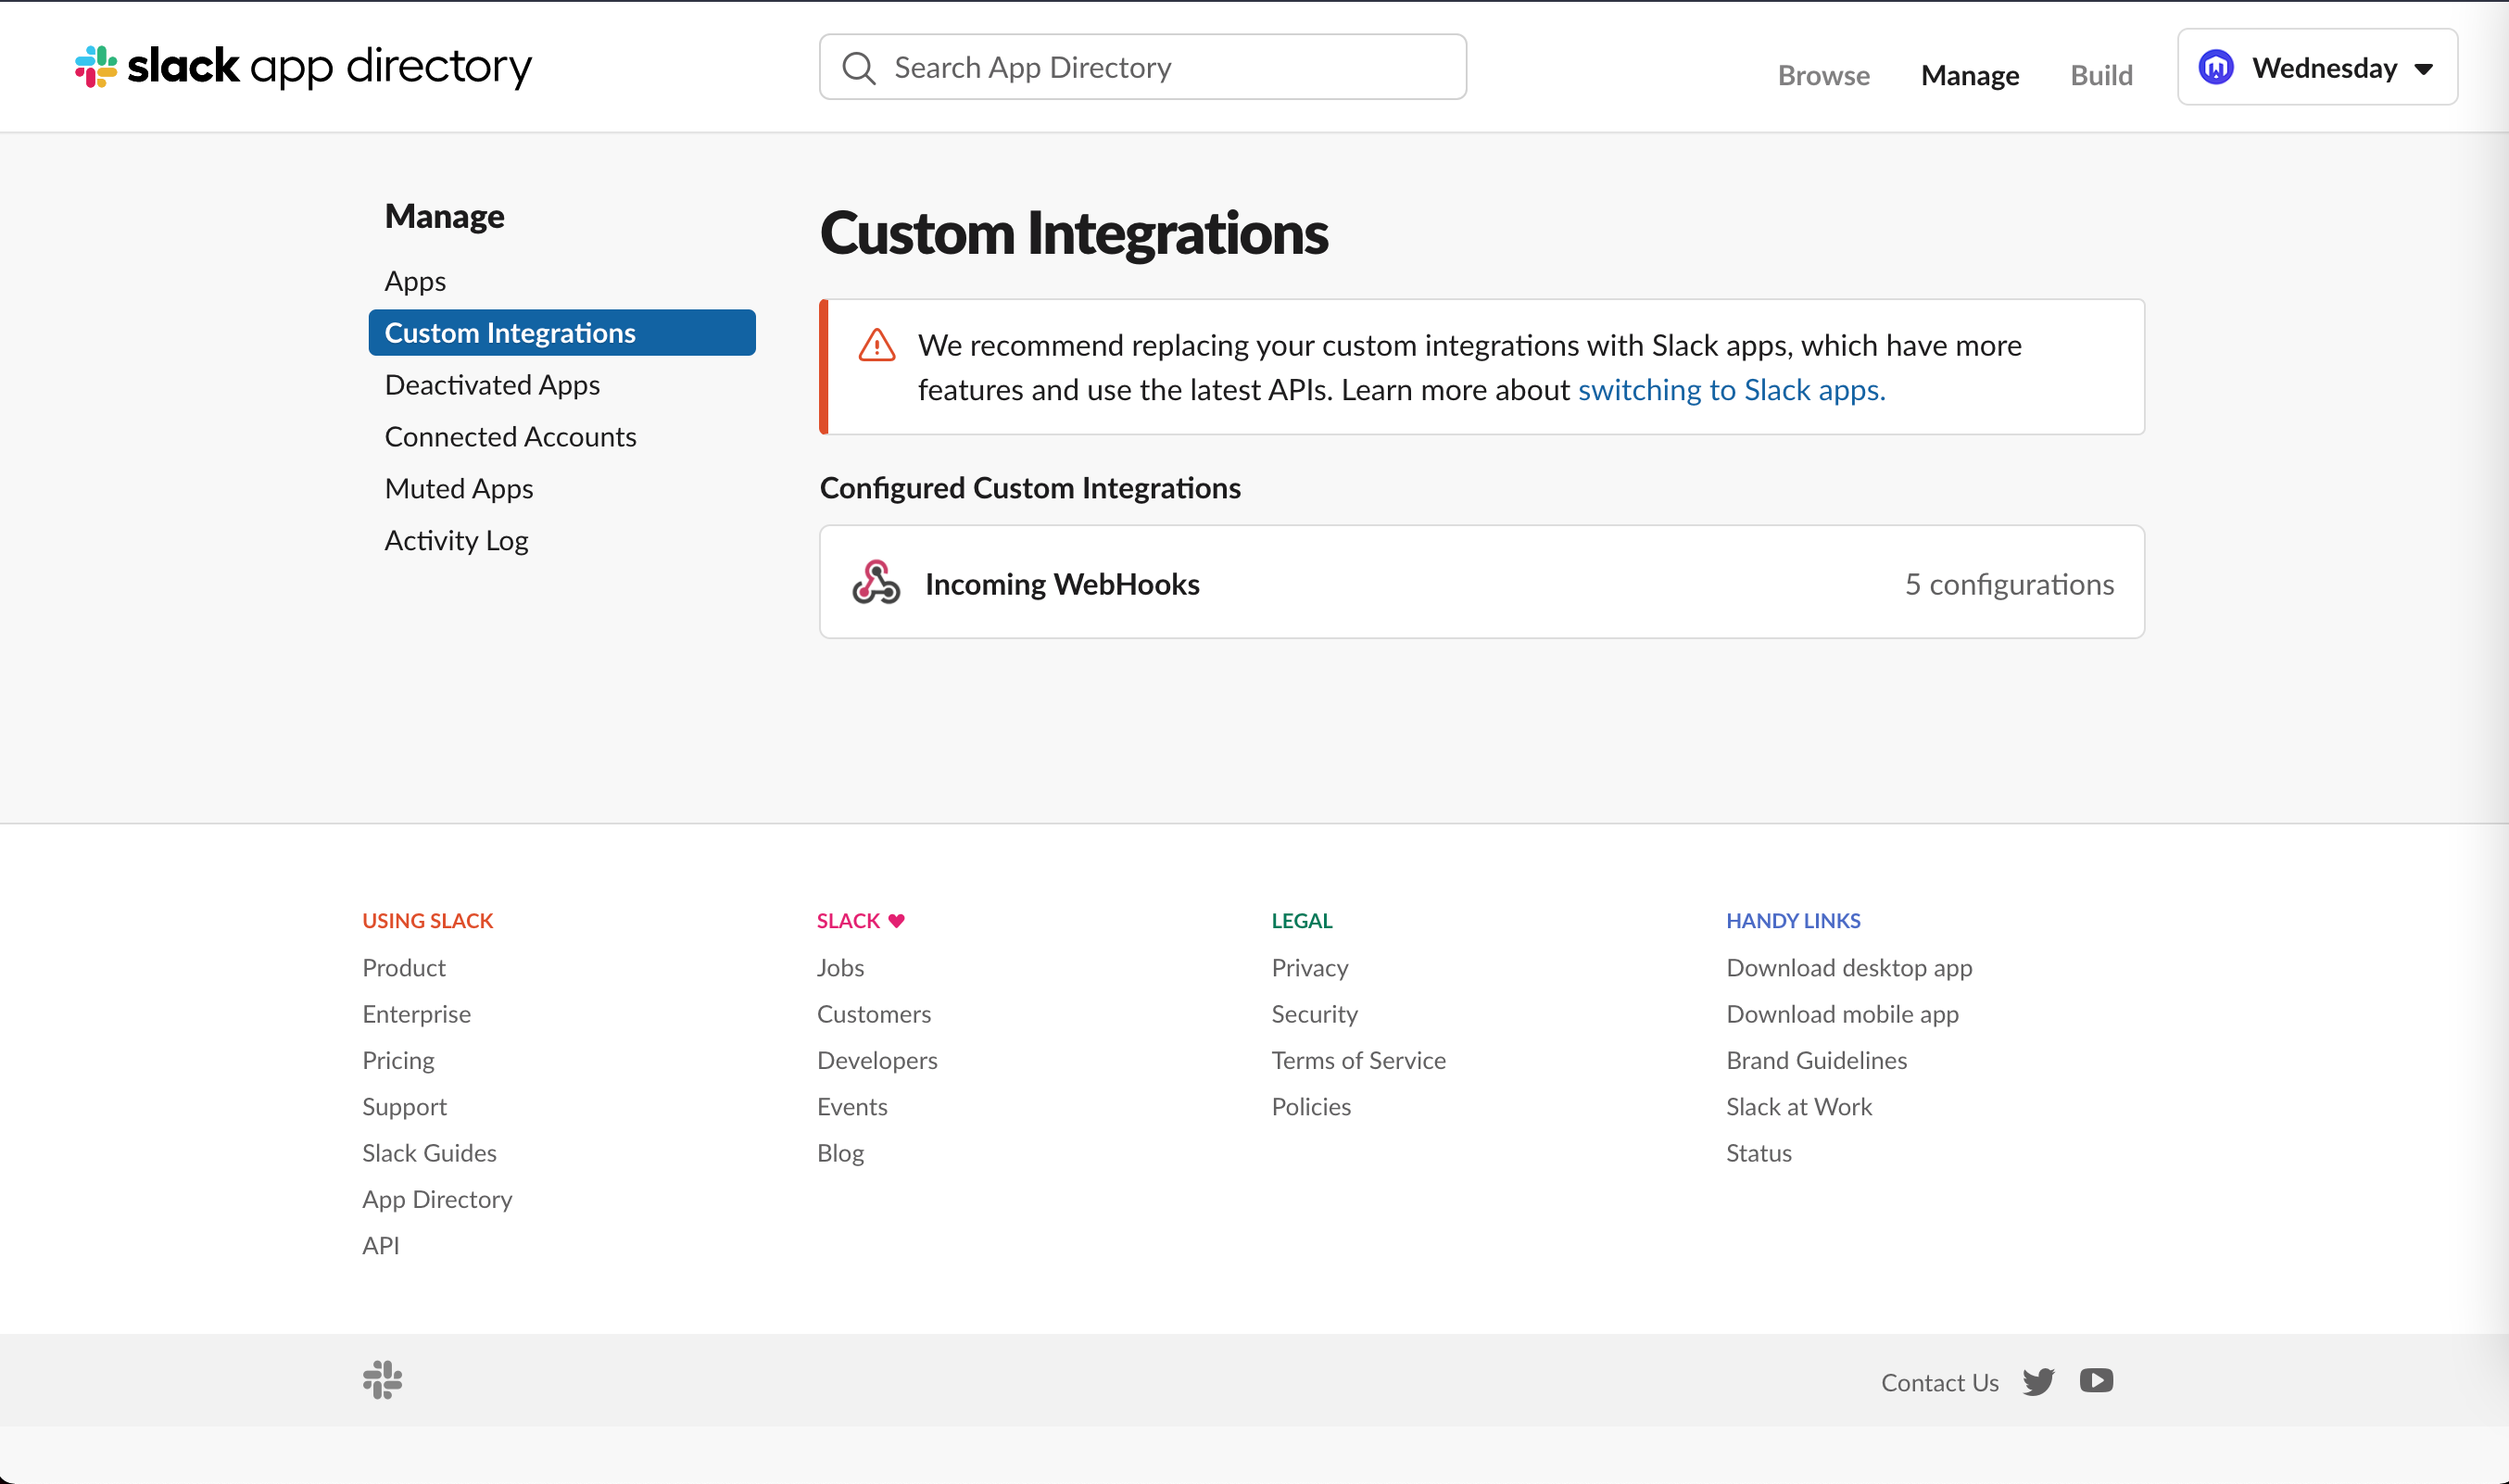
Click on Add to Slack
Choose or create a new channel
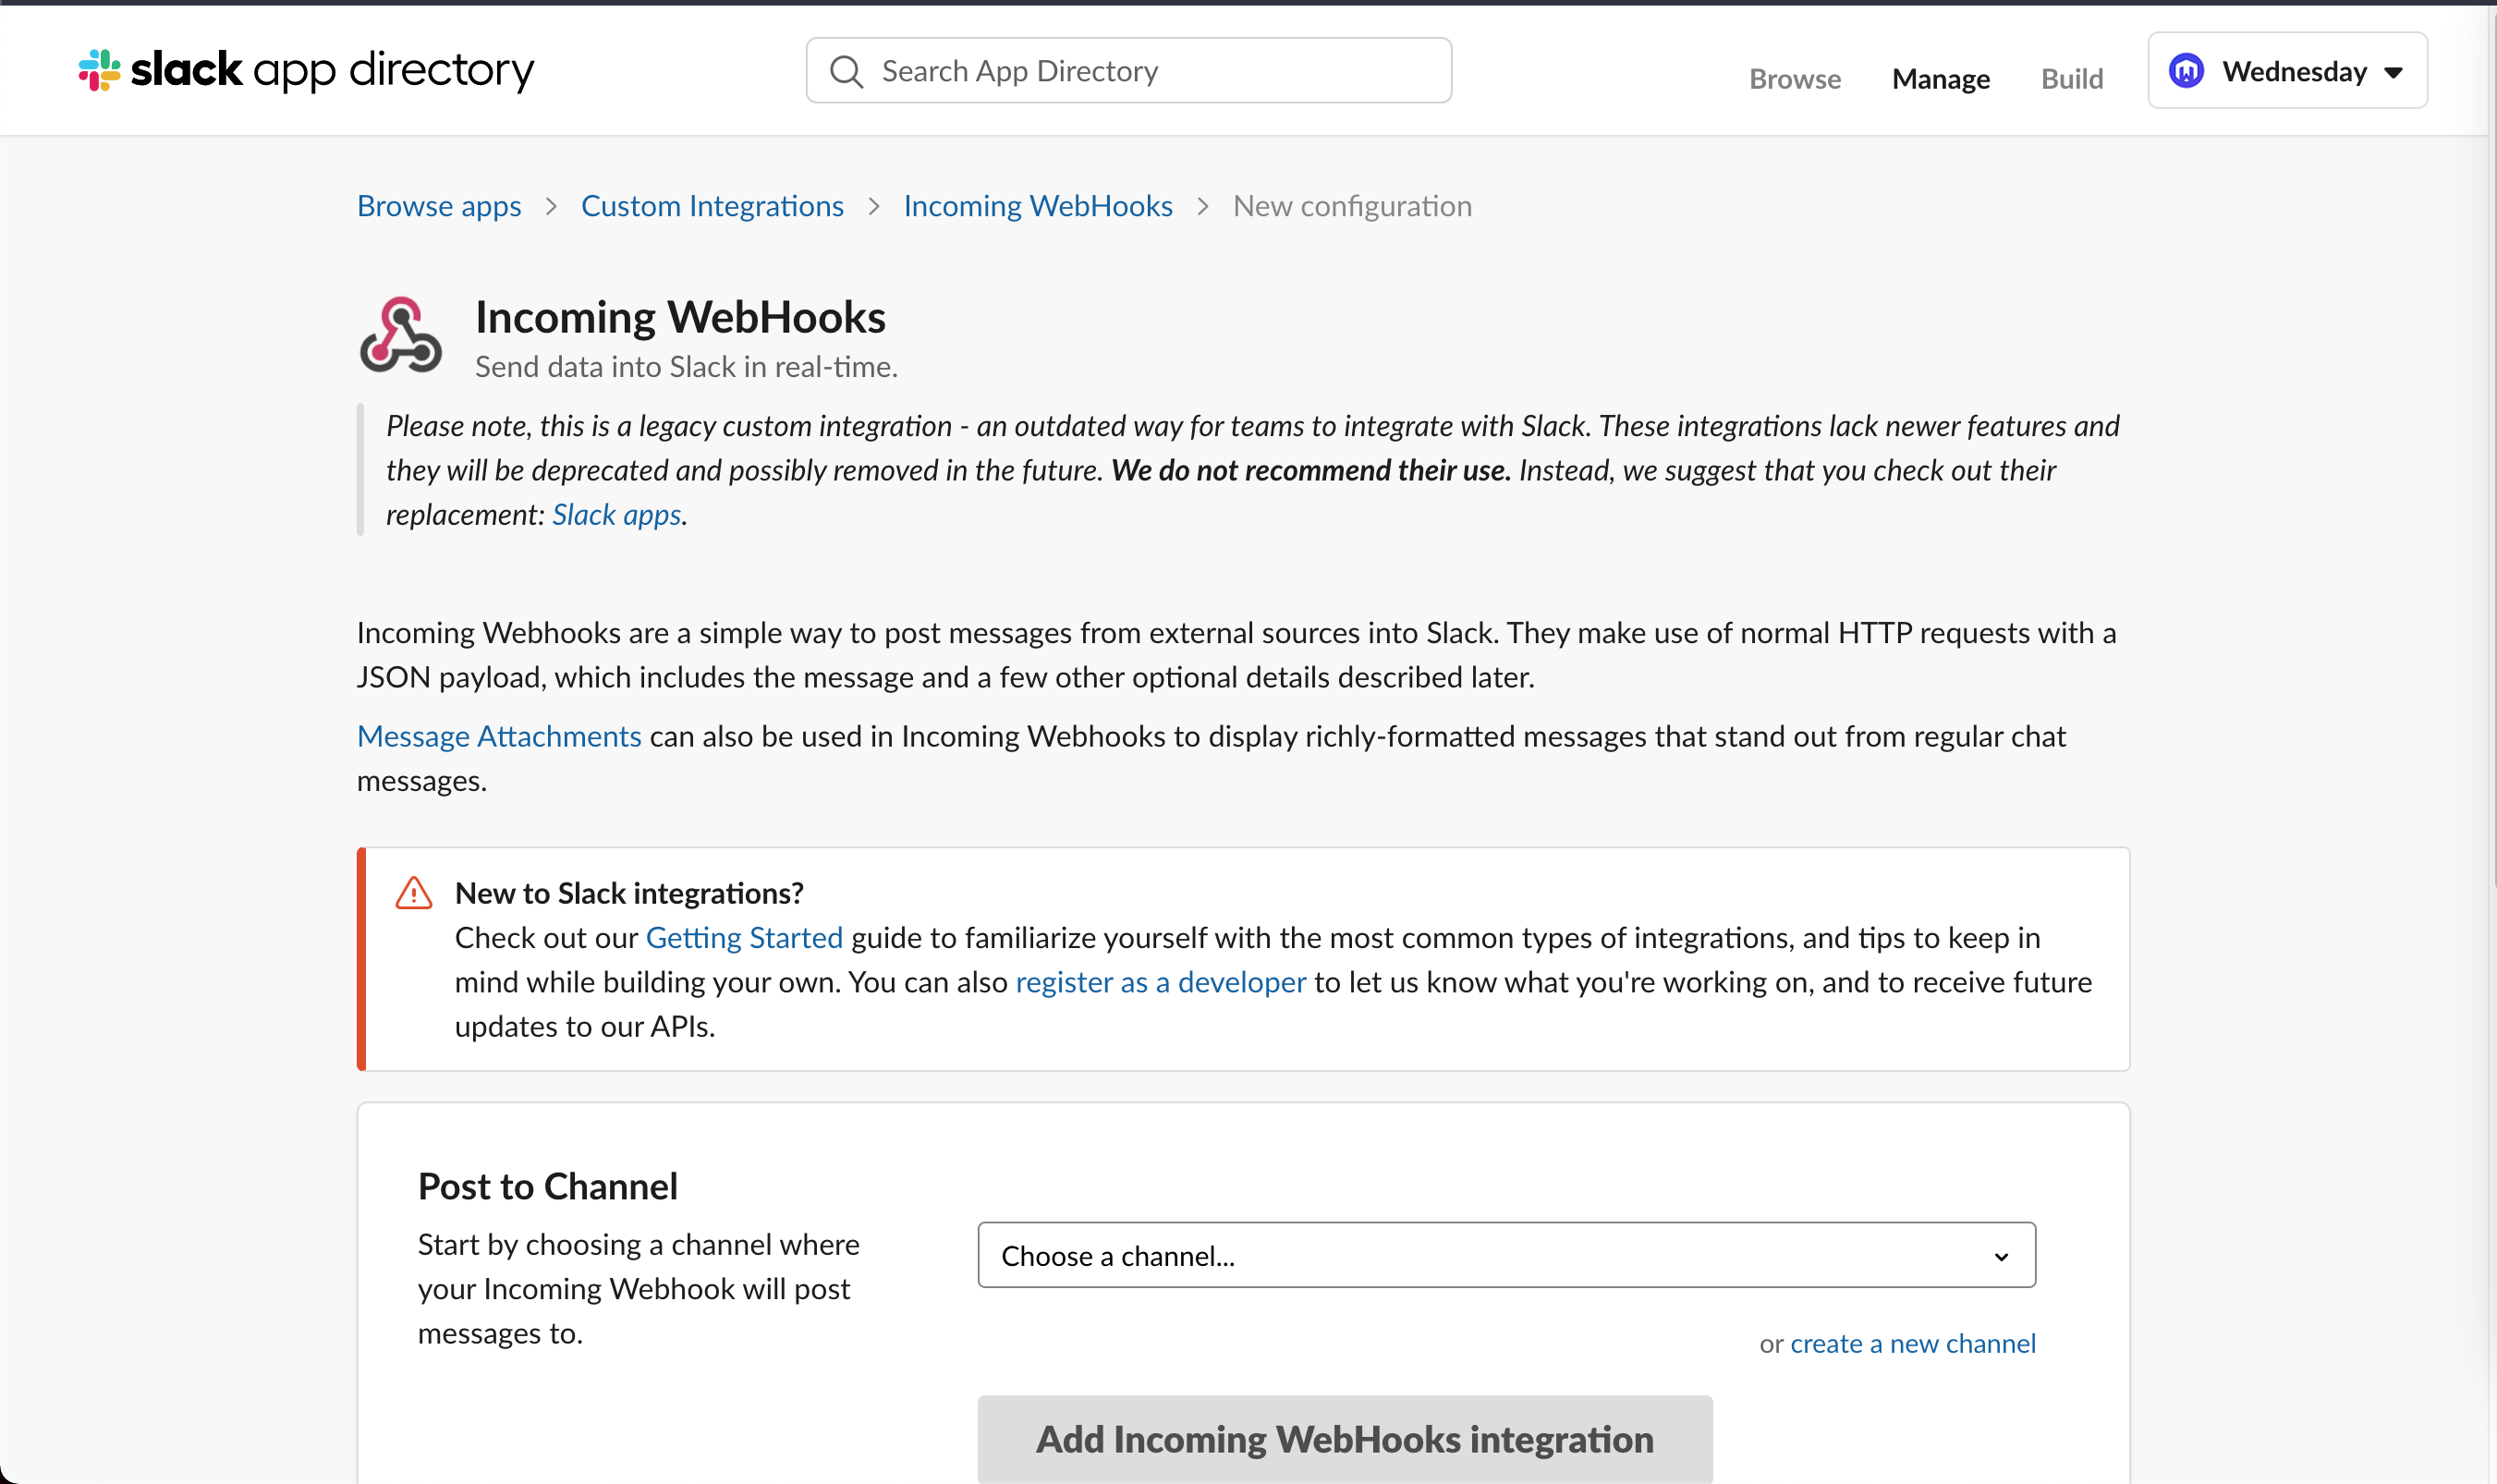
I typically create 2 channels.
One for non-production errors and one for production errors.
- node-express-slack-alerts-dev
- node-express-slack-alerts-production
You can change the name, and icon if you like.
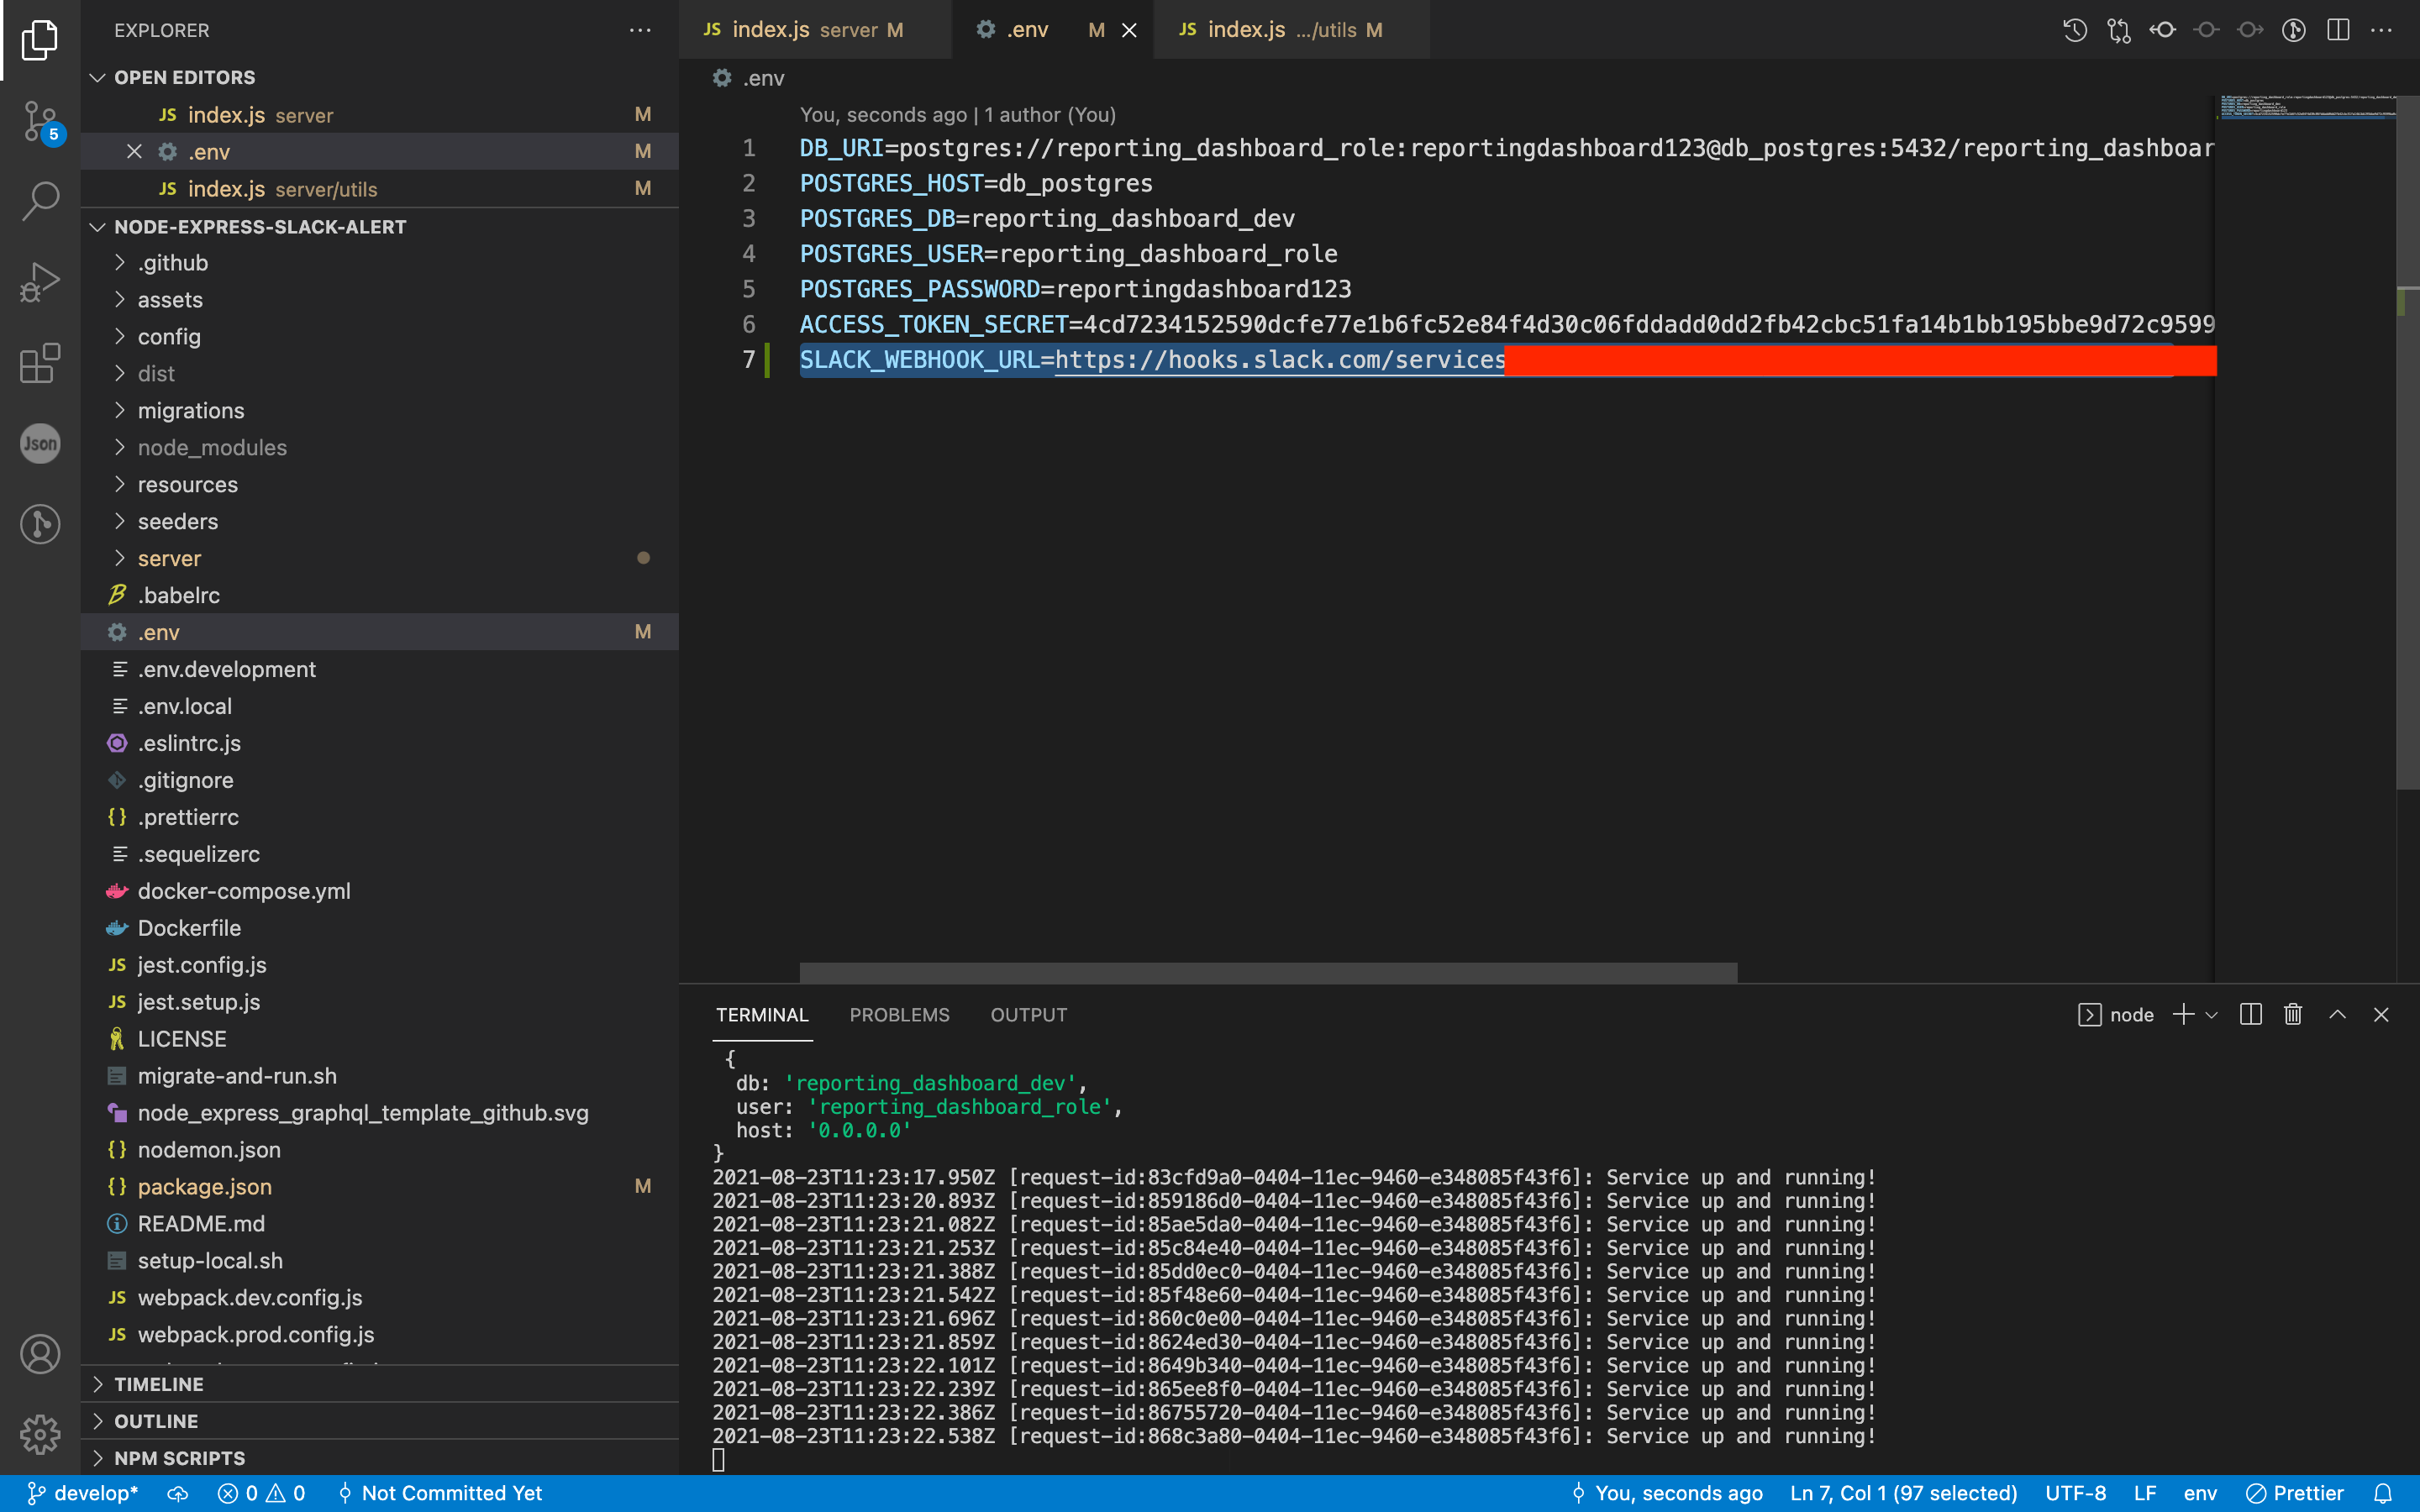
I now have 2 integrations and I will integrate them into my app. We will add them to the .env.development and .env files
Step 3
Create a slack service
Create a file for the slack service using the following command
Copy the following snippet in the slack.js
- Change the if condition in order to test the integration locally.
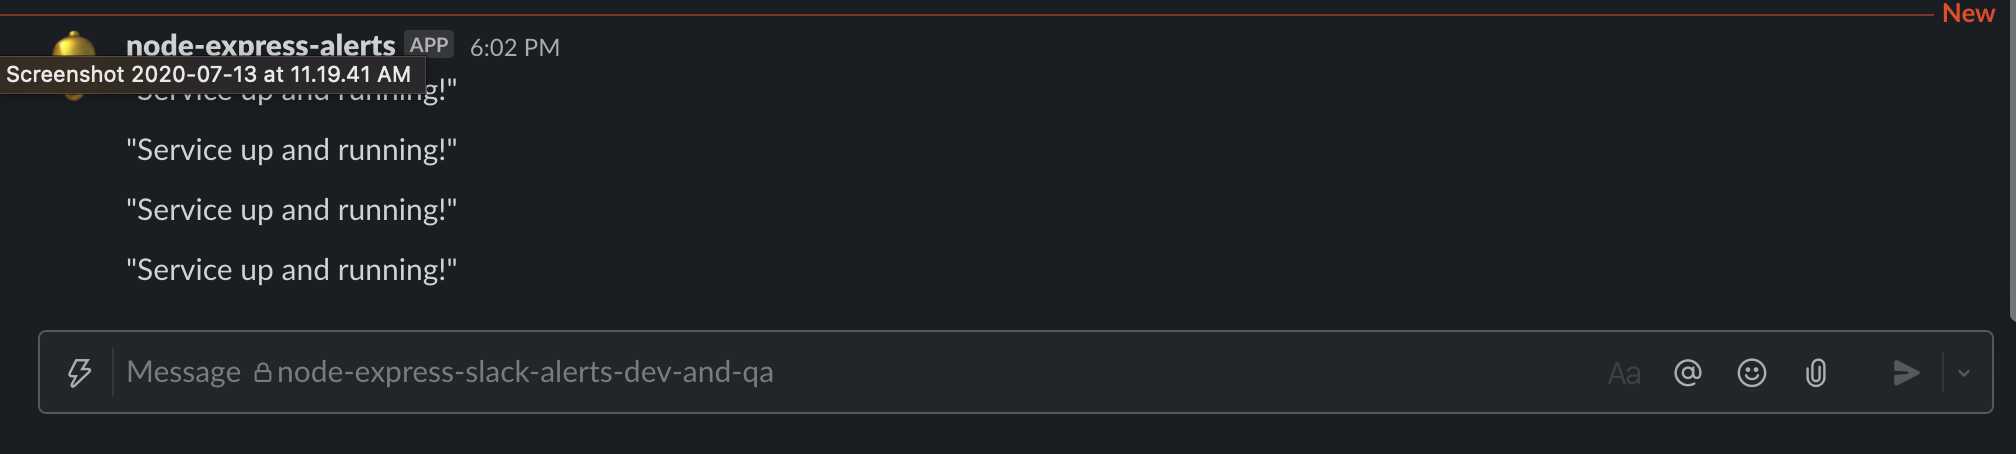
Now import sendMessage in the server/index and invoke it when the health-check api is invoked as follows
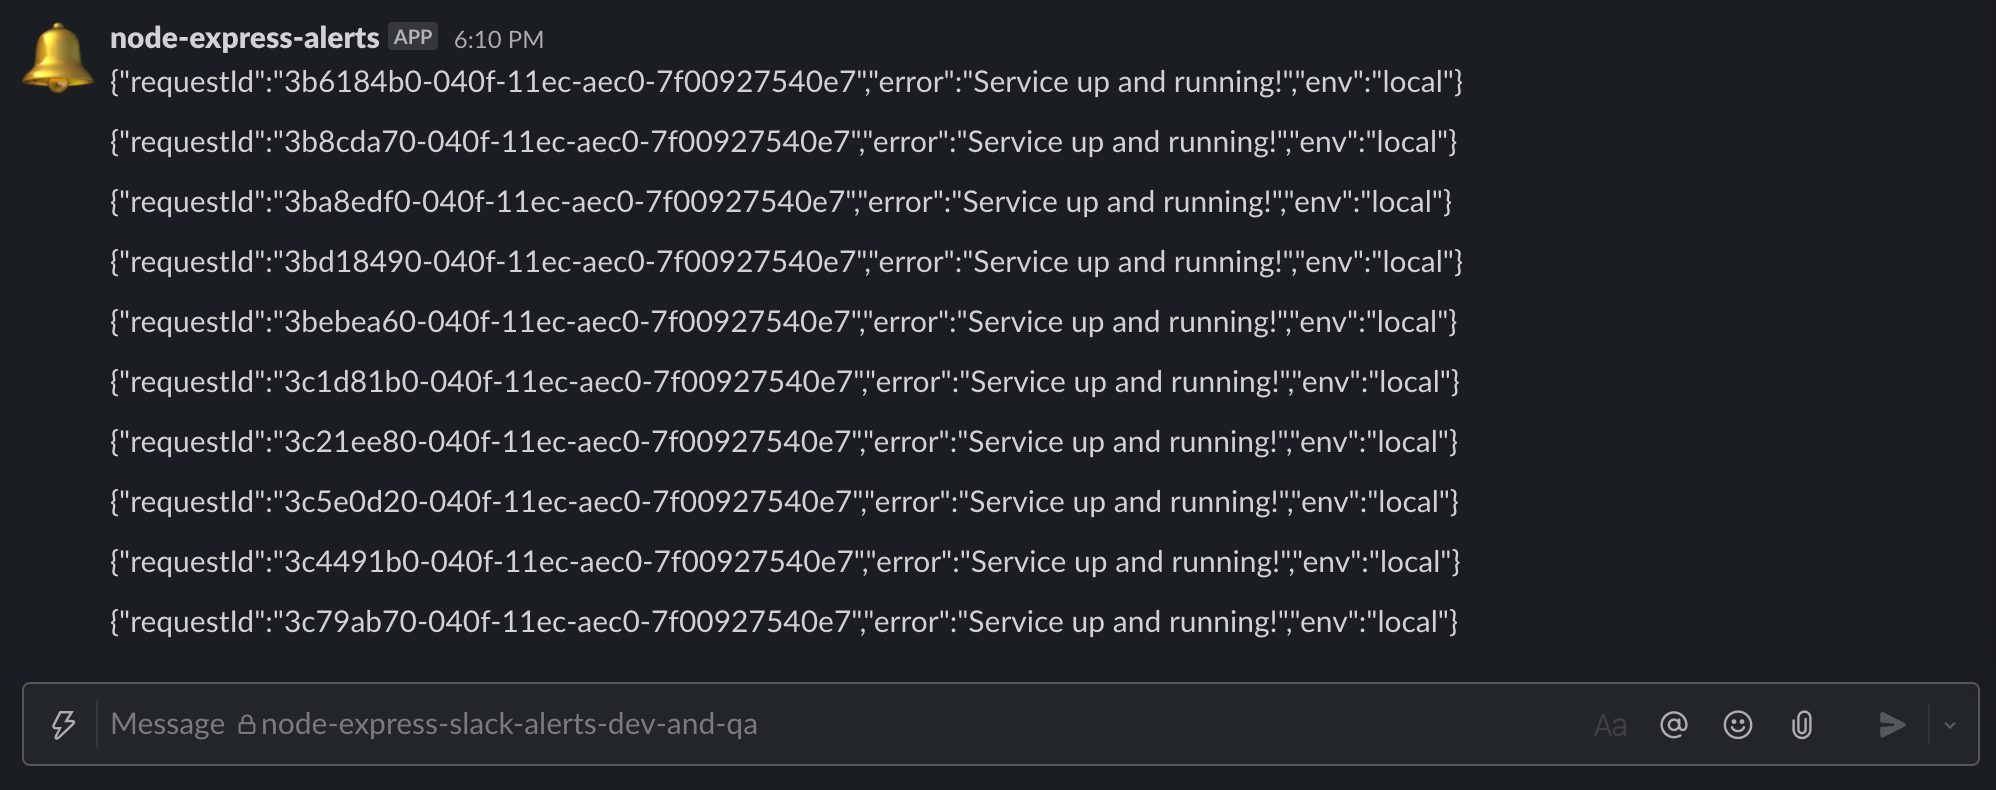
Hit the health check API and you should start seeing slack alerts!
Send the request-id as part of slack alerts
Copy the following snippet
Make the change to the if condition so that you can test out your integration locally.
Hit the health-check API
Where to go from here
You now have the ability to proactively handle errors on the backend.
Use the sendMessage function to capture and report errors to slack. Pull only the relevant logs using the request-id as a filter.
I hope you enjoyed reading this article as much as I enjoyed writing it. If this piqued your interest stay tuned for the next article in the series where I will take you through how to proactively report frontend errors using Sentry.
If you have any questions or comments, please feel free to tweet at us here.