
In the fast-paced world of data engineering and analysis, data modeling plays a vital role in organizing and understanding complex datasets. Whether you're just starting out or looking to expand your knowledge, this comprehensive guide will provide you with everything you need to know about data modeling.
Data Modeling 101: A Comprehensive Guide
Before we dive into the intricacies of data modeling, let's first understand the fundamentals. At its core, data modeling is the process of creating a conceptual representation of data structures, relationships, and rules. By doing so, data modelers are able to design databases that accurately reflect the needs of the organization.
The role of data modeling in data engineering cannot be overstated. It serves as the foundation for data governance, ensuring consistency and integrity across the entire data ecosystem. Data modeling also plays a crucial role in facilitating communication between different stakeholders, bridging the gap between business requirements and technical implementation.
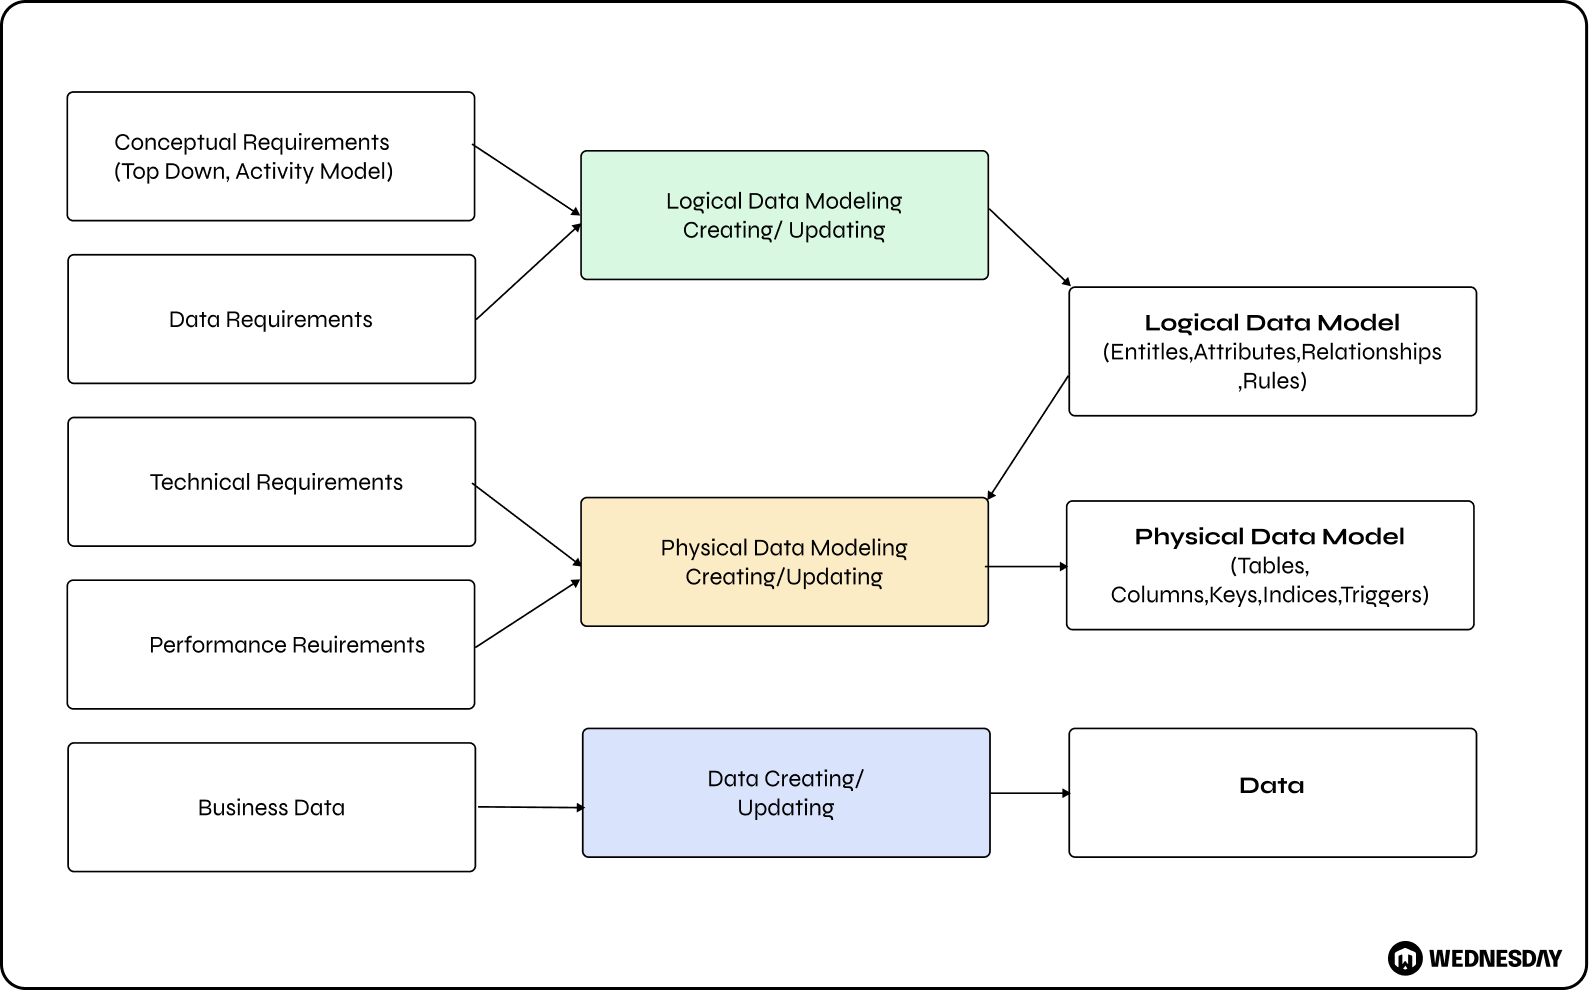
There are different levels of data modeling, each serving a specific purpose. Conceptual data modeling focuses on the big picture, capturing business concepts and their relationships. This level of data modeling allows organizations to gain a high-level understanding of their data assets and how they relate to each other. It helps in identifying key entities, their attributes, and the relationships between them. By creating a conceptual data model, organizations can establish a common understanding of the data and its meaning, enabling effective decision-making and data-driven strategies.
Logical data modeling delves deeper into the details, defining entities, attributes, and relationships. It provides a more granular view of the data, allowing data modelers to define the structure and characteristics of each entity. In this level of data modeling, data modelers use entity-relationship diagrams (ERDs) to represent the entities, their attributes, and the relationships between them. Logical data modeling helps in identifying data dependencies, ensuring data integrity, and optimizing data retrieval and storage. It serves as a bridge between the conceptual and physical data models, translating the business requirements into a technical representation.
Physical data modeling, on the other hand, provides the blueprint for database implementation, specifying tables, columns, and indexes. It focuses on the technical aspects of data storage and retrieval, considering factors such as performance, scalability, and security. In this level of data modeling, data modelers define the physical structure of the database, including the data types, constraints, and indexing strategies. Physical data modeling ensures that the database is designed and optimized to meet the specific requirements of the organization, taking into account the hardware and software environment.
Understanding these levels is essential for mastering the art of data modeling. It requires a combination of technical expertise, domain knowledge, and analytical thinking. Data modelers need to collaborate closely with business stakeholders, subject matter experts, and database administrators to ensure that the data model accurately represents the organization's needs and goals. By creating well-designed data models, organizations can unlock the full potential of their data, enabling informed decision-making, efficient data management, and successful data-driven initiatives.
Unraveling the Evolution of Data Modeling
To truly appreciate the significance of data modeling, it's important to trace its origins. Data modeling has been around since the early days of computing when organizations started to realize the importance of organizing and structuring their data. Over the years, data modeling has evolved alongside advancements in technology, adapting to the ever-changing needs of businesses.
Tracing the Origins and Significance of Data Modeling
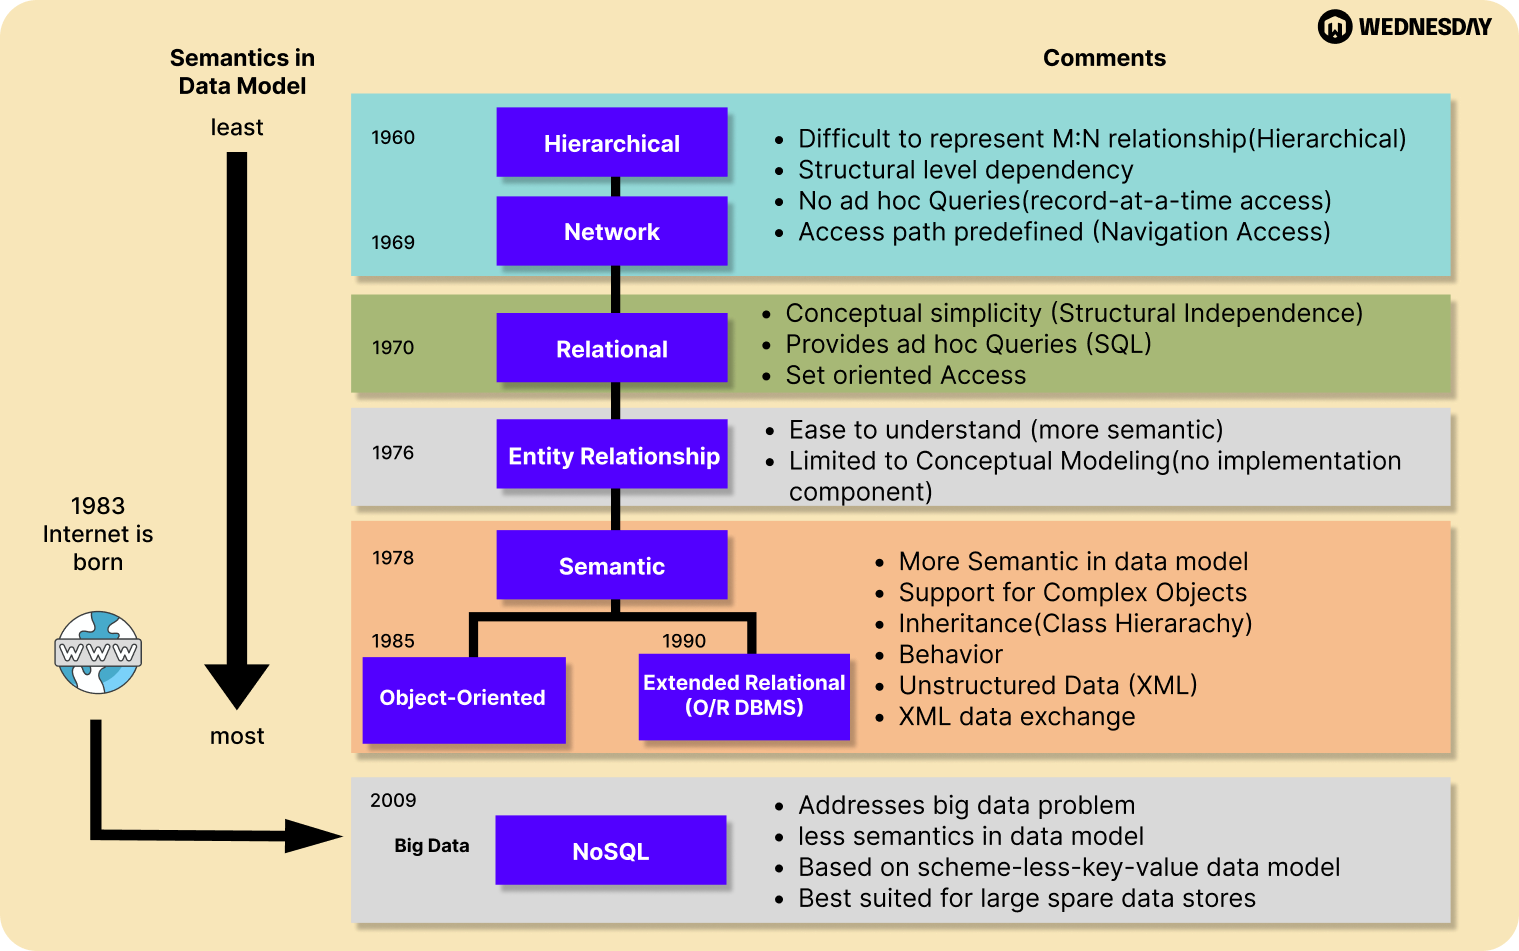
The roots of data modeling can be traced back to the 1970s when the entity-relationship (ER) model was first introduced. This model, developed by Peter Chen, revolutionized the way data was represented and paved the way for more sophisticated modeling techniques. From there, data modeling continued to evolve, with the emergence of other models, such as the relational model and object-oriented model.
The entity-relationship model, or ER model, provided a graphical representation of the relationships between different entities, allowing for a better understanding of how data should be structured. This breakthrough in data modeling laid the foundation for future advancements in the field.
As technology advanced, so did the complexity of data modeling. The relational model, introduced by Edgar F. Codd in the 1970s, introduced the concept of tables and relationships between them. This model revolutionized the way data was stored and queried, making it easier for businesses to manage large amounts of data.
With the rise of object-oriented programming in the 1980s, the object-oriented model emerged as a new approach to data modeling. This model allowed for the representation of real-world objects and their relationships, making it easier to develop complex systems.
Over time, data modeling techniques continued to evolve and adapt to the changing needs of businesses. The emergence of the internet and the explosion of data in the digital age brought new challenges and opportunities for data modeling. Techniques such as dimensional modeling and data warehousing were developed to handle the growing complexity of data.
Navigating the Complexities of Data
In today's data-driven world, it is crucial for data modelers to have a solid understanding of performance analysis. This understanding allows them to navigate the complexities of data and ensure optimal performance as data volumes continue to grow.
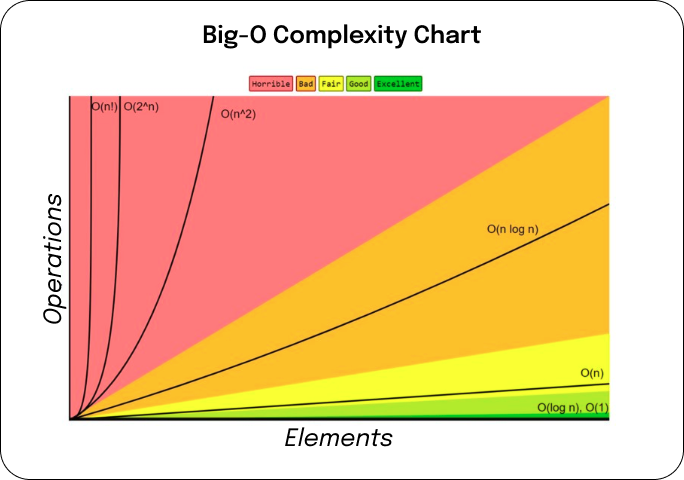
One important concept in performance analysis is Big-O notation. Big-O notation is a mathematical notation used to describe the complexity of an algorithm. By using Big-O notation, data modelers can assess the efficiency and scalability of their database designs. This knowledge helps them make informed decisions and optimize their data models for better performance.
Demystifying Big-O Notation and Its Relevance
Big-O notation may seem intimidating at first, but it is a powerful tool for data modelers. It provides a standardized way to measure the efficiency of algorithms, regardless of the programming language or hardware used. By understanding Big-O notation, data modelers can analyze the performance of different algorithms and choose the most efficient ones for their specific needs.
For example, let's say a data modeler needs to sort a large dataset. They can use Big-O notation to compare the efficiency of different sorting algorithms, such as bubble sort, merge sort, or quicksort. By choosing the algorithm with the lowest complexity, they can significantly improve the performance of their data model.
The Importance of Granularity and Roll-Up in Data Analysis
When it comes to data analysis, granularity and roll-up are two important concepts that data modelers must understand. Granularity refers to the level of detail captured in a dataset. Choosing the right level of granularity is essential for accurate analysis and reporting.
For example, consider a sales dataset. If the data is captured at the individual transaction level, it provides a high level of granularity. This level of detail allows for precise analysis, such as identifying the best-selling products or analyzing customer behavior. On the other hand, if the data is rolled up to a higher level, such as monthly or quarterly sales, it provides a more aggregated view. This level of granularity is useful for tracking overall performance and identifying trends over time.
Roll-up, on the other hand, refers to the process of summarizing data at a higher level. It is often used to create meaningful insights from large datasets. By rolling up data, data modelers can simplify complex information and present it in a more digestible format.
For example, imagine a data modeler working with a dataset that contains daily sales data for multiple stores. By rolling up the data to a weekly or monthly level, they can analyze the overall sales performance of each store and identify patterns or anomalies. This aggregated view allows for easier comparison and identification of trends.
How Data Modeling Can Simplify Complex Data Structures
Complex data structures can often pose a challenge for data modelers. However, data modeling techniques can help simplify these structures, making them more manageable and easier to work with.
One common technique used in data modeling is breaking down complex data into smaller, more manageable components. This process, known as decomposition, involves identifying the different entities and relationships within the data and representing them in a structured manner.
For example, let's say a data modeler is working with a complex customer relationship management (CRM) system. The CRM system may have multiple tables and relationships, such as customers, orders, and products. By decomposing the data and representing each entity separately, the data modeler can create a more organized and understandable data model.
Another technique used in data modeling is abstraction. Abstraction involves simplifying complex data by focusing on the most relevant aspects and ignoring unnecessary details. This helps data modelers create a more concise and efficient data model.
For instance, consider a data modeler working with a large dataset that includes customer demographics, purchase history, and website interactions. By abstracting the data and focusing on the key attributes and relationships, the data modeler can create a simplified representation that captures the essential information without overwhelming complexity.
Navigating the complexities of data requires a deep understanding of performance analysis, including concepts like Big-O notation, granularity, roll-up, and data modeling techniques. By mastering these concepts, data modelers can optimize their database designs, produce meaningful insights, and make informed decisions that drive business success.
Mastering Key Concepts in Data Modeling
Unveiling the Power of Metrics and KPIs
Metrics and key performance indicators (KPIs) are essential tools for measuring and monitoring the success of a business. In the context of data modeling, understanding how to define and track metrics and KPIs is crucial for designing effective databases. By aligning data models with business objectives, data modelers can ensure that the right data is captured and analyzed to drive decision-making.
Normalization vs. Denormalization: Which is Right for You?
Normalization and denormalization are two techniques used in data modeling to optimize database performance. Normalization involves breaking down data into smaller, more atomic units to eliminate redundancy and ensure data integrity. Denormalization, on the other hand, combines data from multiple sources to improve query performance. Understanding the pros and cons of each approach is key to making the right design choices.
Understanding the History of Slowly Changing Dimensions (SCD)
In the world of data warehousing, slowly changing dimensions (SCD) play a key role. SCDs refer to dimensions in a database that change slowly over time, requiring special handling in order to maintain accurate historical records. Understanding the different types of SCDs and how to model them is essential for building robust and reliable data warehouses.
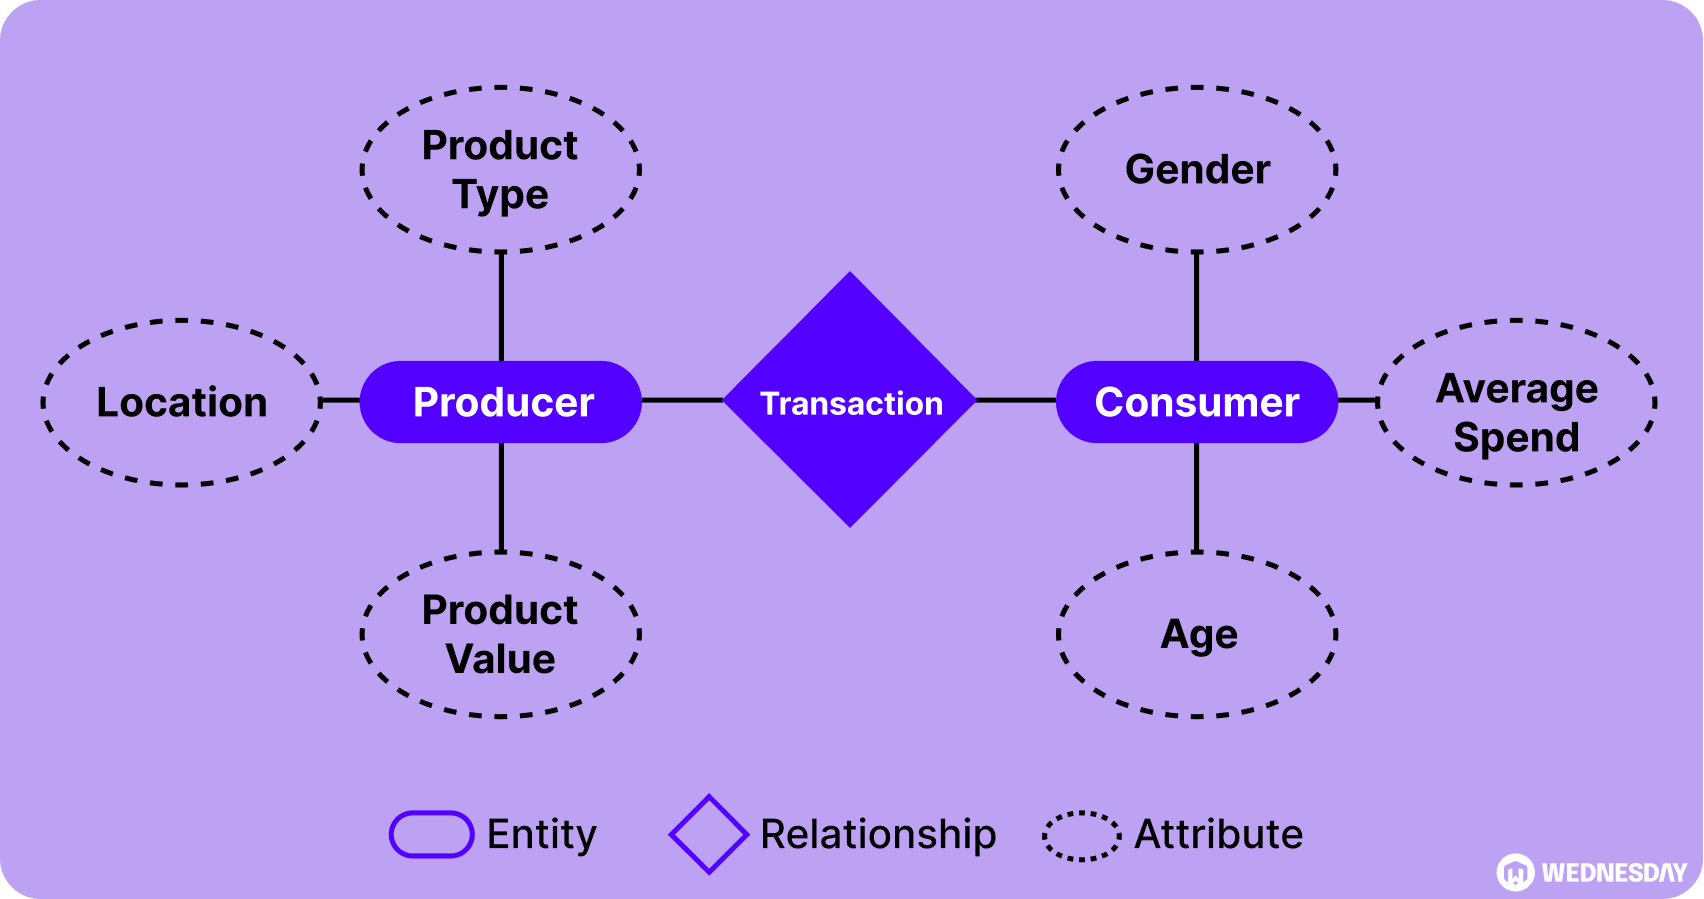
Visualizing Data Relationships with Entity Relationship Diagrams (ERD)
Entity Relationship Diagrams (ERDs) are powerful tools for visualizing complex data relationships. With ERDs, data modelers can visually represent entities, attributes, and relationships, making it easier to understand and communicate the structure of a database. Mastering the art of ERD design is essential for effective data modeling.
What's Next on Your Data Modeling Journey?
Thank for reading this so far. This is Part 1 of our comprehensive guide to data modeling. You've learned the fundamentals, traced the evolution of data modeling, navigated the complexities of data, and mastered key concepts. In Part 2, we'll take a deeper dive and explore advanced topics such as dimensional modeling, data modeling for NoSQL databases, and data modeling best practices. Stay tuned!
As always if you need help with a data engineering endeavour and would like to explore our services book a few consult here.
Enjoyed the article? Join the ranks of elite C Execs who are already benefiting from LeadReads. Joins here.